
Picture this: It’s Monday morning, as Head of Support at a growing SaaS company, you open your dashboard to find something unexpected. Instead of the usual flood of escalated tickets, you see a clear trend emerging from last week’s customer interactions. Your customer support team’s new approach to handling billing inquiries has driven customer satisfaction scores up by 12% - and more importantly, you can prove it with data that speaks directly to revenue impact. The customer support team plays a crucial role in driving satisfaction and maintaining loyalty at every touchpoint.
This isn’t a fantasy scenario. It’s what happens when support leaders move beyond gut feelings and start measuring customer satisfaction with precision.
According to research from Bain & Company, companies that excel at customer experience grow revenues 4-8% above their market, with much of that insight coming directly from support interactions that happen every single day.
The challenge? Most support teams are sitting on a goldmine of customer sentiment data but lack the framework to transform daily conversations into strategic business intelligence. Support leaders use various data sources—such as CSAT, NPS, social media monitoring, and focus groups—to understand customer sentiment and gain deeper insights into loyalty and overall experience. The opportunity is massive: support functions have the most direct, real-time access to customer attitudes and satisfaction levels in any organization. When you can measure and track the right customer satisfaction metrics, you transform from a reactive cost center into a proactive revenue driver.
Sharing customer satisfaction insights across the entire business helps improve collaboration, customer understanding, and revenue strategies. Here’s how to build that measurement framework with seven essential metrics that every support leader needs to track.

What is Customer Satisfaction?
Customer satisfaction is the degree to which customers feel their expectations have been met or exceeded during their interactions with your company. For support leaders, this translates into a measurable indicator of how well your team resolves issues, reduces customer effort, and creates positive experiences that drive business outcomes. Measuring the consumer's satisfaction experience involves assessing perceptions of quality and post-purchase attitudes to gauge how satisfied customers are with your product or service.
Why does this matter for your support function? Simple. Satisfied customers cost less to serve, generate more revenue through repeat purchases, and become advocates who reduce your acquisition costs. They’re also far less likely to churn, which directly impacts your bottom line. Understanding customer satisfaction is a key indicator of loyalty and future behavior, helping you predict repurchase intent and make informed business decisions.
The consequences of poor customer satisfaction measurement are stark: you miss early customer churn signals, allocate resources inefficiently, and struggle to demonstrate your team’s strategic value to executives. Poor customer service can lead to negative reviews and customer dissatisfaction. Without clear satisfaction data, support becomes a reactive expense rather than a proactive investment in customer lifetime value.
Targeted actions throughout the customer journey can help achieve customer satisfaction and improve the overall experience.

Why Should You Measure Customer Satisfaction?
Support teams have a unique superpower that’s often underutilized: direct, real-time access to customer sentiment. While other departments rely on periodic surveys or delayed feedback, your agents interact with customers daily, hearing their frustrations, celebrating their wins, and uncovering insights that can transform business strategy. Support teams also collect and analyze customer data from feedback, surveys, and interactions, providing a comprehensive view of customer needs and experiences.
This positions support leaders to become invaluable partners to CX teams and executive leadership. When you track customer satisfaction systematically, you create a bridge between frontline customer interactions and boardroom business decisions. Your data becomes the early warning system for retention risks and the roadmap for product improvements.
Consider the cross-functional impact: your satisfaction metrics inform product roadmaps, guide marketing messaging, and provide CX teams with the granular insights they need to optimize the entire customer journey. Customer satisfaction feedback is essential for identifying trends and areas for improvement, ensuring continuous enhancement of service quality. Instead of operating in silos, you become the central hub for customer intelligence.
7 Key Customer Satisfaction Metrics to Track
The following seven metrics form the foundation of a comprehensive customer satisfaction measurement strategy for support and CX leaders. Each metric serves as a key performance indicator for service quality and overall customer experience.
Each metric provides a different lens for understanding customer experience, from immediate interaction feedback to long-term business impact. Using specific satisfaction measures helps gauge overall satisfaction and perceptions of quality. Together, they create a complete picture that enables both tactical improvements and strategic decision-making.
1. Customer Satisfaction Score (CSAT)
Customer Satisfaction Score (CSAT) measures immediate satisfaction with specific interactions, typically captured through post-contact surveys asking “How satisfied were you with your support experience today?” on a 1-5 or 1-10 scale. In addition to overall satisfaction, attribute satisfaction measurements can be used to assess satisfaction with particular product or service features by including targeted survey questions about specific attributes.
For support leaders, CSAT provides the most direct feedback on team performance and process effectiveness. Unlike broader satisfaction measures, CSAT pinpoints exactly which interactions drive positive or negative experiences, enabling targeted coaching and process improvements.
Track CSAT by agent, issue type, and resolution method to identify coaching opportunities and best practices
Aim for 80%+ satisfaction rates while monitoring trends more than absolute scores
Use CSAT data to optimize knowledge bases and identify common friction points
Combine with qualitative feedback to understand the “why” behind satisfaction scores
2. Net Promoter Score (NPS)
Net Promoter Score (NPS) measures customer loyalty by asking “How likely are you to recommend our company to a friend or colleague?” on a 0-10 scale. Customers rating 9-10 are promoters, 7-8 are passives, and 0-6 are detractors.
While NPS typically falls under CX team ownership, support interactions significantly influence these scores. Your team’s ability to resolve issues effectively often determines whether a frustrated customer becomes a detractor or remains neutral. More importantly, exceptional support experiences can convert satisfied customers into active promoters. Identifying and nurturing loyal customers is crucial, as they drive repeat business and advocate for your brand.
Monitor how support interactions impact overall NPS trends to demonstrate your team’s business contribution
Identify patterns in detractor feedback related to support experiences
Track NPS by customer segment to understand which groups need additional support attention
Use promoter feedback to identify support behaviors worth scaling across your team
3. Customer Effort Score (CES)
Customer Effort Score (CES) measures how easy it was for customers to resolve their issues, typically asking “How easy was it to get your issue resolved today?” Research consistently shows that reducing customer effort drives loyalty more effectively than exceeding expectations. CES also captures how the customer feels about the effort required to resolve their issue, providing insight into their emotional response and overall satisfaction.
For support teams, CES is perhaps the most actionable satisfaction metric. It directly reflects your processes, knowledge base effectiveness, and agent training quality. High effort scores often indicate systemic issues that, once resolved, can dramatically improve both satisfaction and operational efficiency.
Focus on effort reduction rather than effort elimination - small improvements yield significant loyalty gains
Identify high-effort interaction patterns that suggest process or training opportunities
Track effort by channel (phone, chat, email) to optimize resource allocation
Use CES to justify self-service investments that reduce customer effort while lowering costs
Recommended graphic: CES trends over time with effort reduction initiative milestones marked
4. First Contact Resolution (FCR)
First Contact Resolution (FCR) measures the percentage of customer issues resolved during the initial interaction without requiring follow-up contacts. This metric bridges operational efficiency with customer satisfaction, as customers strongly prefer having their problems solved immediately. Analyzing customer support interactions can help identify opportunities to improve FCR and enhance the overall customer experience.
High FCR rates typically correlate with higher satisfaction scores and lower operational costs. Each additional contact attempt increases customer frustration while consuming more resources. For support leaders, FCR provides clear insight into knowledge gaps, process inefficiencies, and training needs.
Benchmark FCR rates by issue complexity to set realistic targets and identify improvement opportunities
Track FCR alongside CSAT to ensure resolution speed doesn’t compromise satisfaction quality
Use low FCR categories to prioritize knowledge base and training investments
Monitor FCR by agent to identify coaching opportunities and best practice sharing
5. Average Resolution Time
Average Resolution Time tracks how long it takes to resolve customer issues from initial contact to final resolution. While speed matters to customers, this metric requires careful interpretation - faster isn’t always better if it compromises resolution quality or increases repeat contacts.
For support leaders, resolution time provides insights into process efficiency, issue complexity, and resource allocation needs. The key is finding the optimal balance between speed and thoroughness that maximizes customer satisfaction while maintaining operational efficiency. Optimizing resolution time can help create highly satisfied customers who are more likely to advocate for your brand.
Segment resolution time by issue type and complexity to set appropriate expectations and targets
Monitor resolution time trends to identify seasonal patterns or emerging issues
Balance speed with quality metrics like FCR and CSAT to avoid gaming behaviors
Use resolution time data to optimize staffing and skill-based routing strategies
6. Customer Retention Rate
Customer Retention Rate measures the percentage of customers who continue their relationship with your company over specific time periods. While retention is influenced by many factors, support experiences often serve as the deciding factor when customers consider leaving.
Support interactions provide early warning signals for retention risks. Customers who contact support multiple times, express frustration, or have unresolved issues are statistically more likely to churn. By tracking these patterns, support leaders can implement proactive retention strategies and demonstrate clear business impact.
Correlate support interaction patterns with churn data to identify early warning indicators
Track retention rates by customer segment to prioritize support attention where it drives the most value
Monitor satisfaction scores for at-risk customer segments and identify unhappy customers to address their needs and improve retention to enable proactive outreach
Use retention insights to influence product development and process improvement priorities
7. Customer Lifetime Value (CLV)
Customer Lifetime Value (CLV) represents the total revenue a customer generates throughout their relationship with your company. While typically calculated by finance or analytics teams, support interactions significantly influence CLV through their impact on retention, upsell opportunities, and customer advocacy.
Understanding how support experiences affect CLV transforms how executives view your function’s value. When you can demonstrate that improving support satisfaction increases average customer lifetime value by thousands of dollars, budget conversations shift from cost reduction to strategic investment. This directly contributes to overall business success and long-term growth.
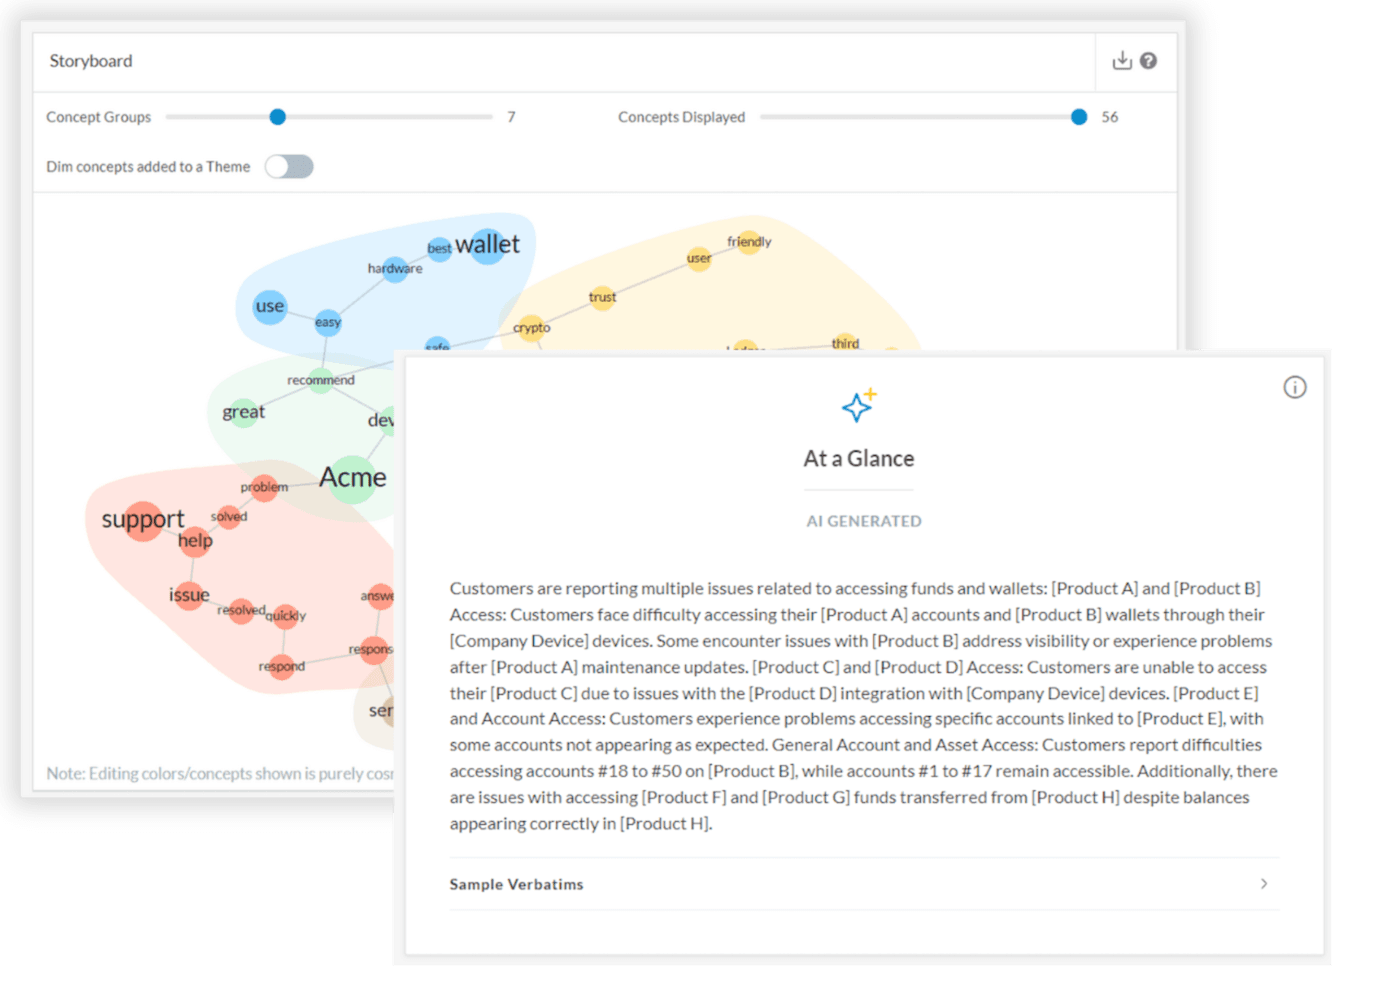
This is where modern customer feedback analytics platforms like Kapiche become invaluable for support leaders. Kapiche’s new support-focused features help you connect daily support interactions to broader business outcomes:
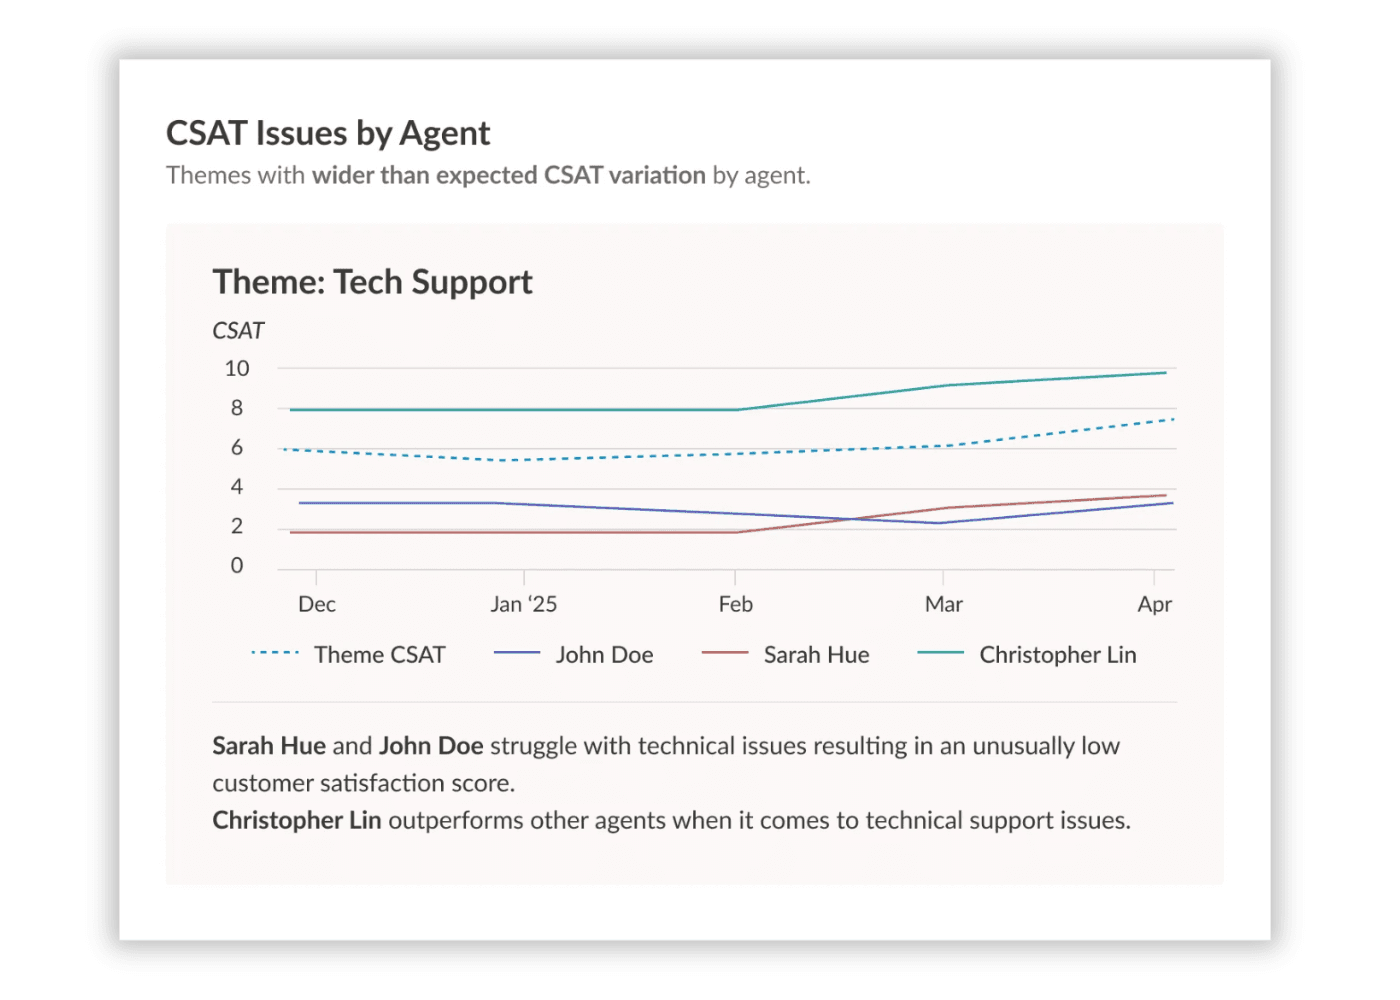
Agent QA scorecards provide 100% coverage of support interactions, not just random samples, giving you complete visibility into how agent performance impacts satisfaction
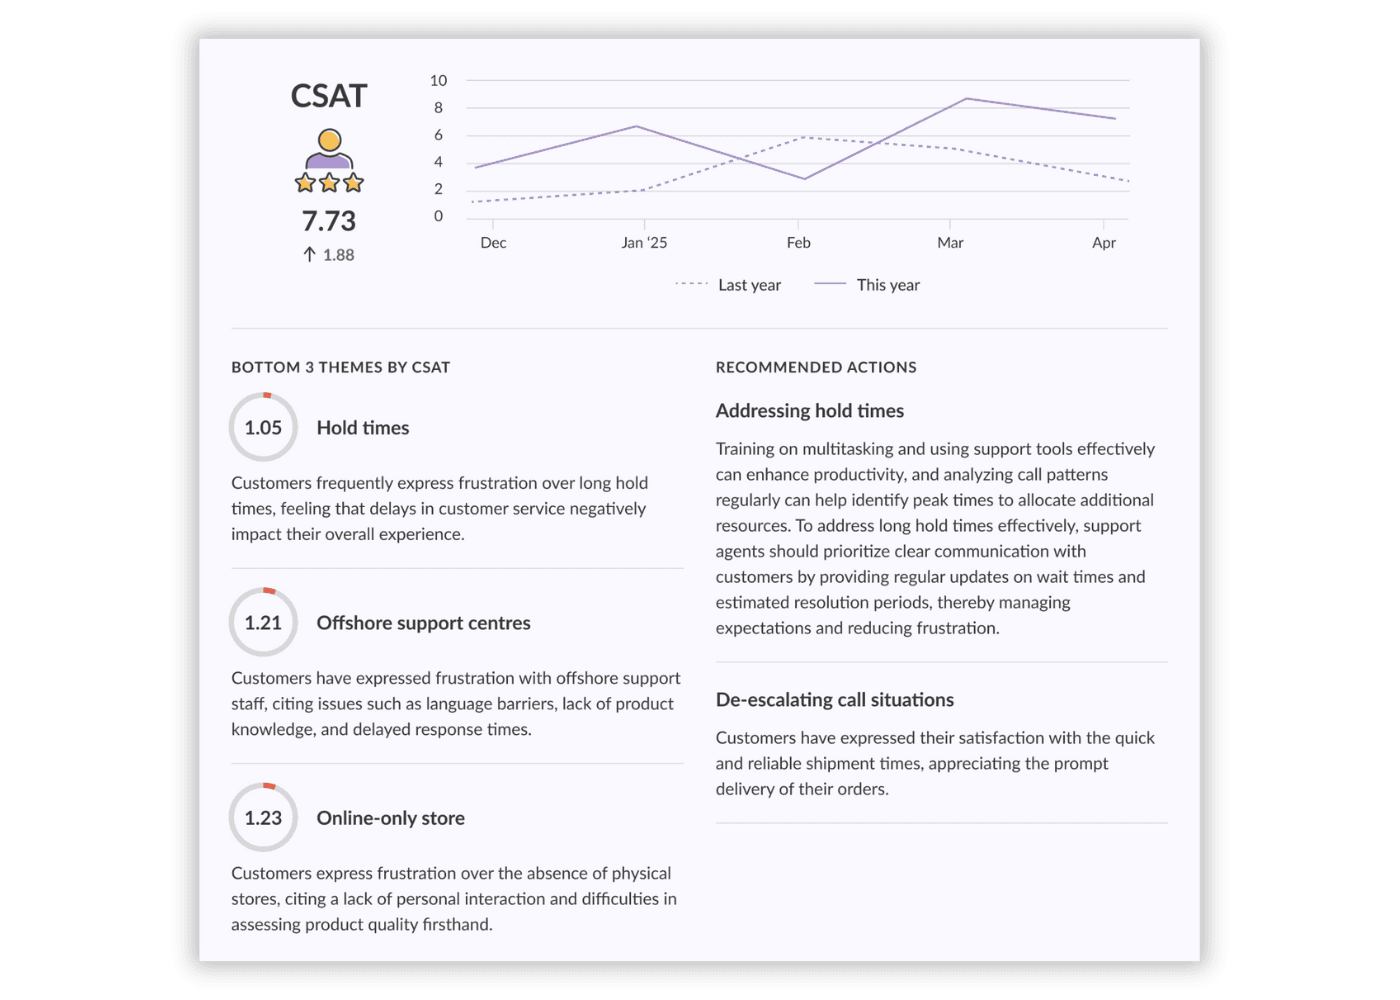
CSAT overview dashboards show real-time satisfaction trends with AI-generated recommendations for addressing bottom-performing themes
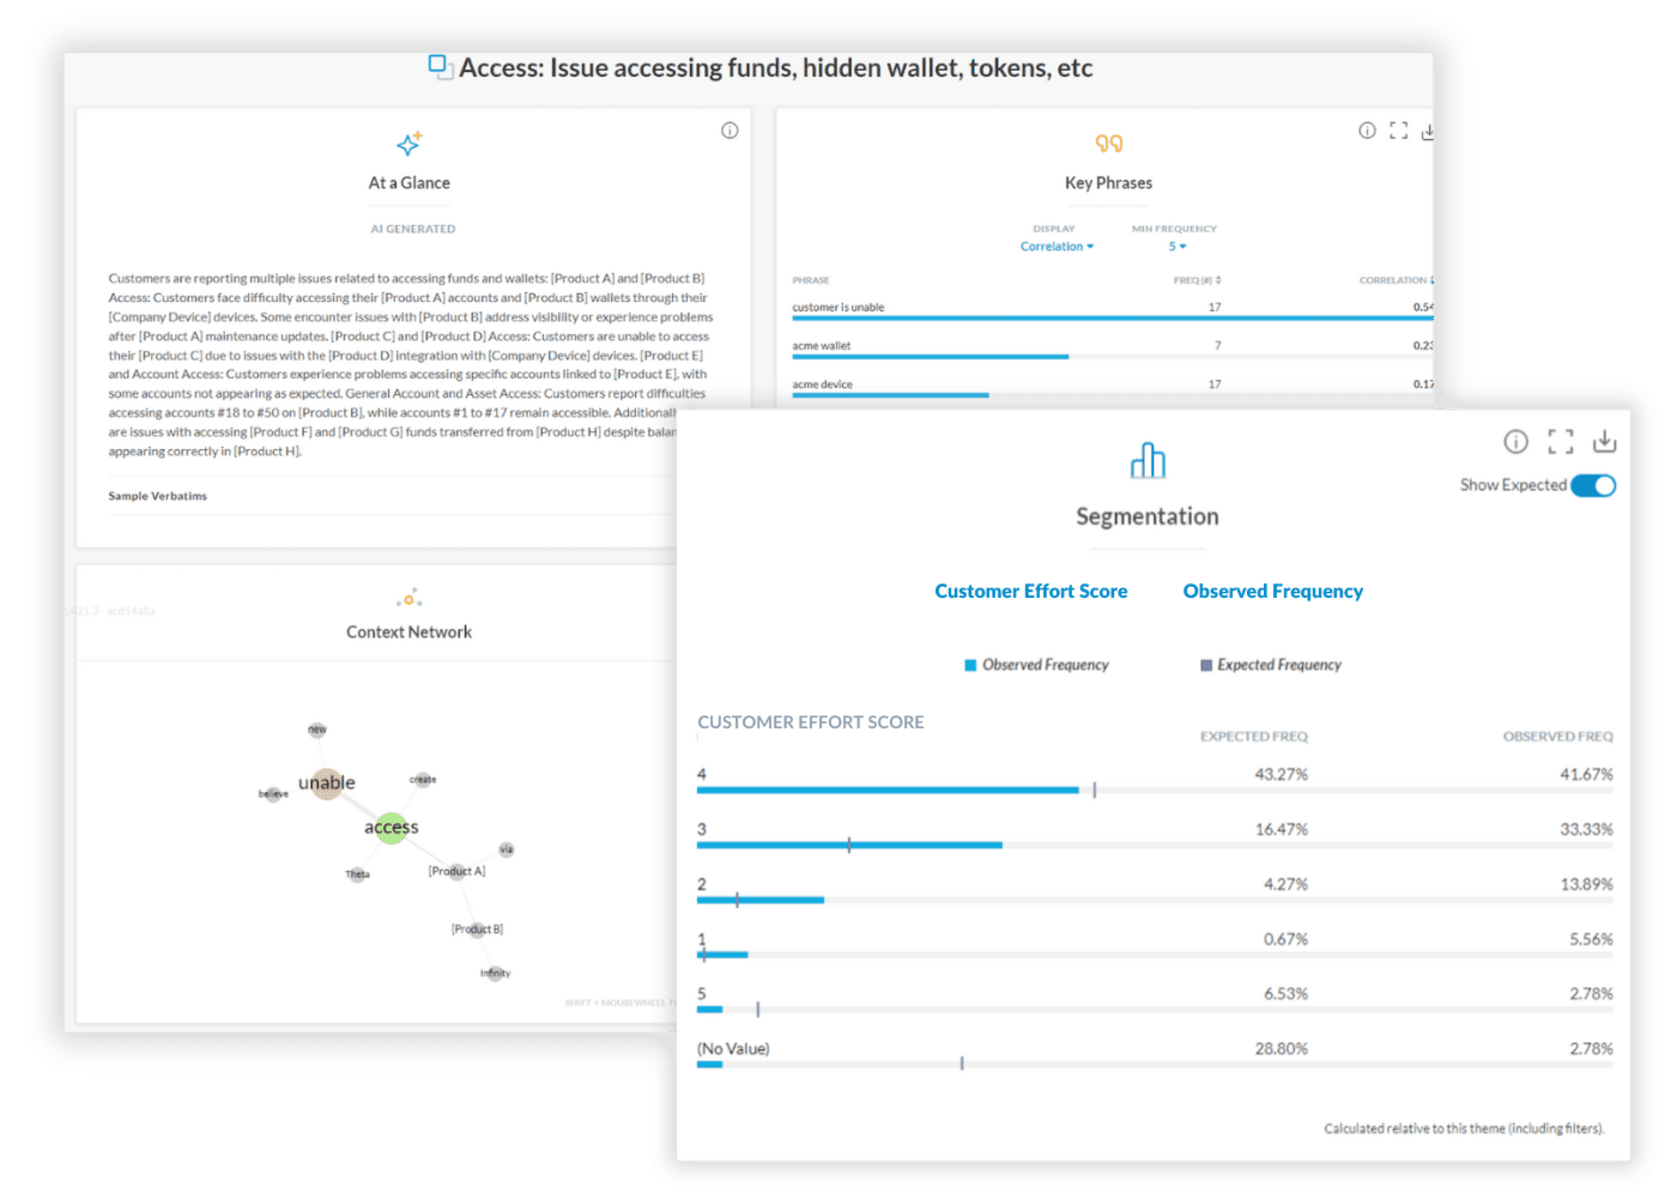
Theme outlier detection automatically identifies unusual spikes in customer issues before they impact broader satisfaction metrics
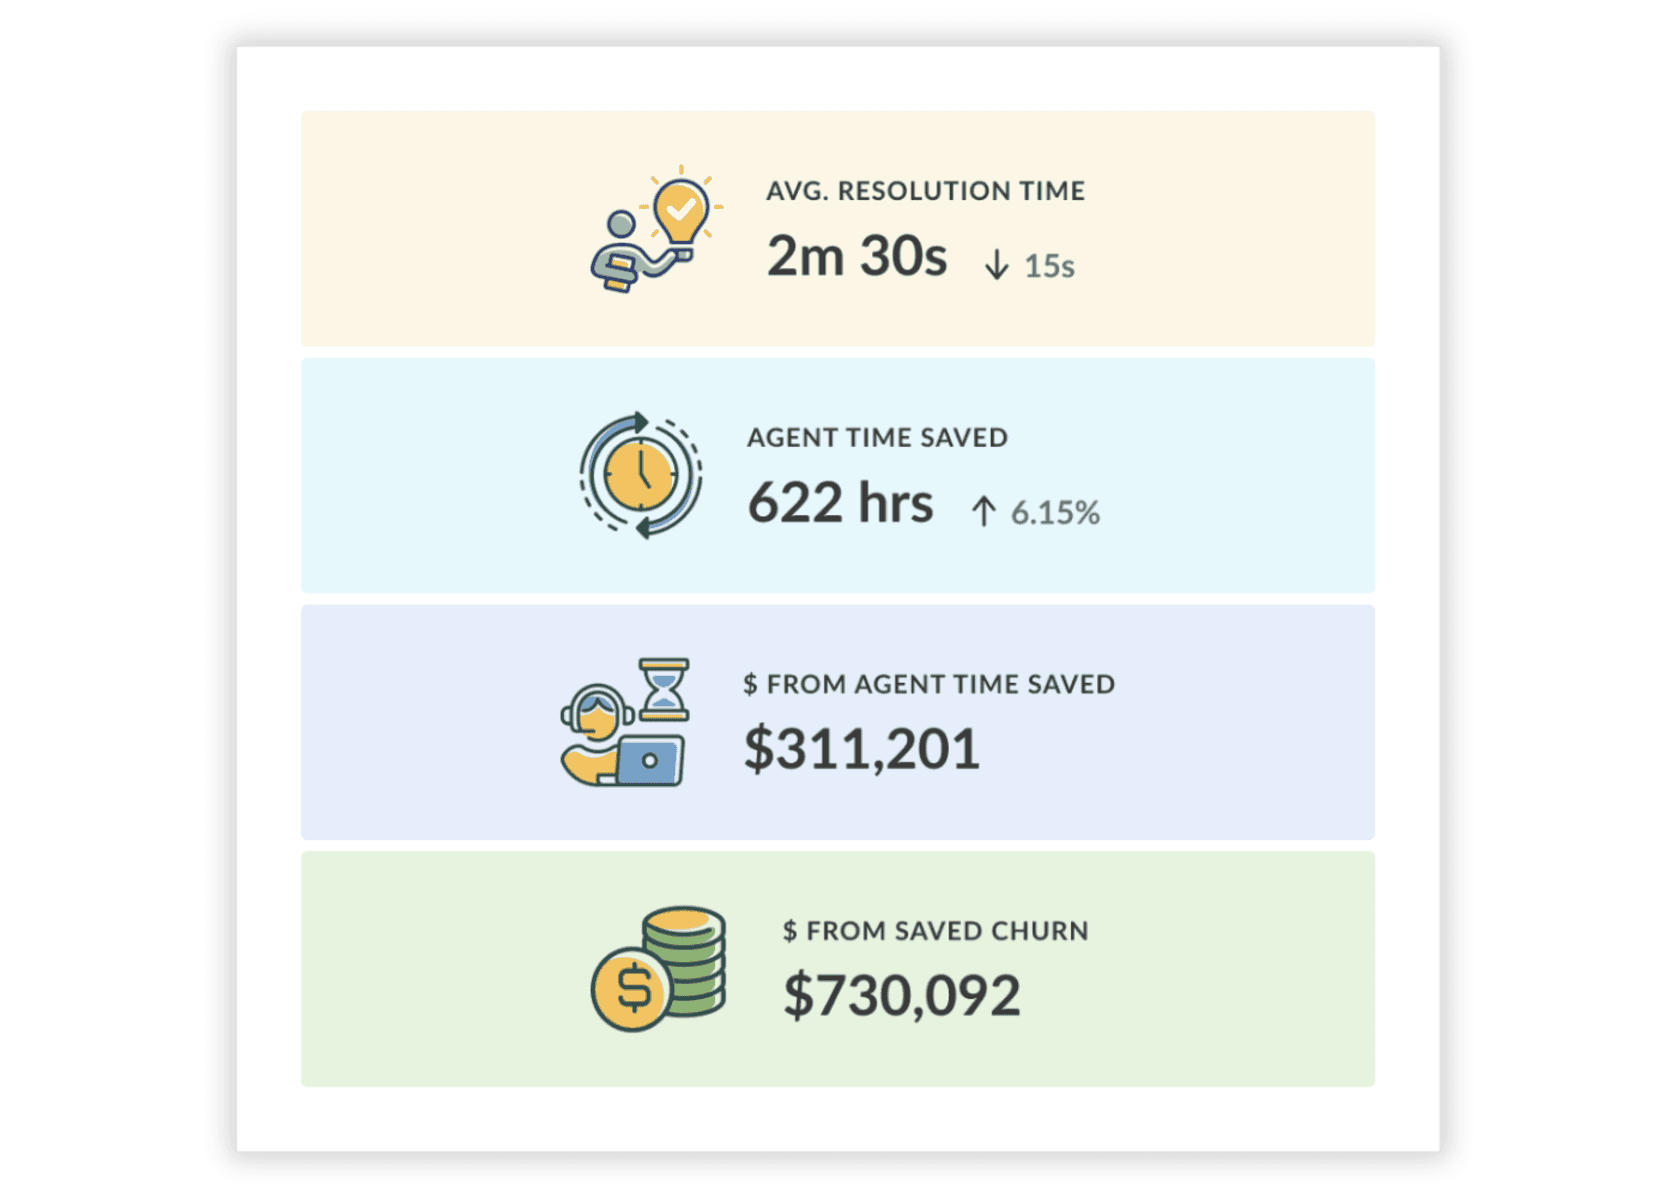
Track CLV correlation with support satisfaction scores to quantify your team’s revenue impact
By analyzing 100% of customer conversations rather than relying on survey samples, you gain the insights needed to share meaningful reports with CX teams and executives, demonstrating how support excellence drives customer lifetime value and business growth.