Effective reporting of customer insights can make or break the impact of your data.
It’s one thing to have a platform like Kapiche surfacing rich insights about customer sentiment, satisfaction, and pain points. It’s another to distill these insights into an actionable, clear story that your organization can act on.
Knowing how to report insights effectively bridges the gap between raw data and informed decision-making.
In this playbook, we’ll walk you through the essential elements of customer insights reporting that spark action, and align with your company’s goals—so the data you work hard to gather doesn’t go unused.
Step 1: Understanding Your Audience and Their Needs
Reporting that gets results starts with knowing your audience inside out. Not everyone reading your insights report will have the same priorities, technical knowledge, or role in decision-making.
Tailoring reports to meet the specific needs of each stakeholder ensures that your insights resonate and that each person sees the value in acting on them.
Key Considerations for Audience-Centric Reporting:
Identify Key Stakeholders and Their Interests: Who will be reading this report? Are they in customer experience, product development, or marketing? Think about their goals and what insights will resonate most with each group.
Vary the Detail Level for Different Audiences: Higher-level executives might only need summaries and trend visuals, while customer-facing teams might require specific action items or detailed metrics.
Communicate ROI and Strategic Value: For audiences focused on ROI, tie your insights to business outcomes, such as potential revenue impact from improvements or cost savings from resolving customer pain points sooner.
Tip: Consider creating brief personas for each major audience type to refer back to as you build reports. A dashboard might feature key trendlines for executives while showing granular feedback metrics for insights teams.
Step 2: Structuring Your Report for Maximum Clarity
Effective reports don’t just list findings—they tell a clear story that guides the audience through the insights and actions.
Organizing your report around a logical flow ensures each section builds on the previous one, helping your audience understand why certain insights are important and what they should do with them.
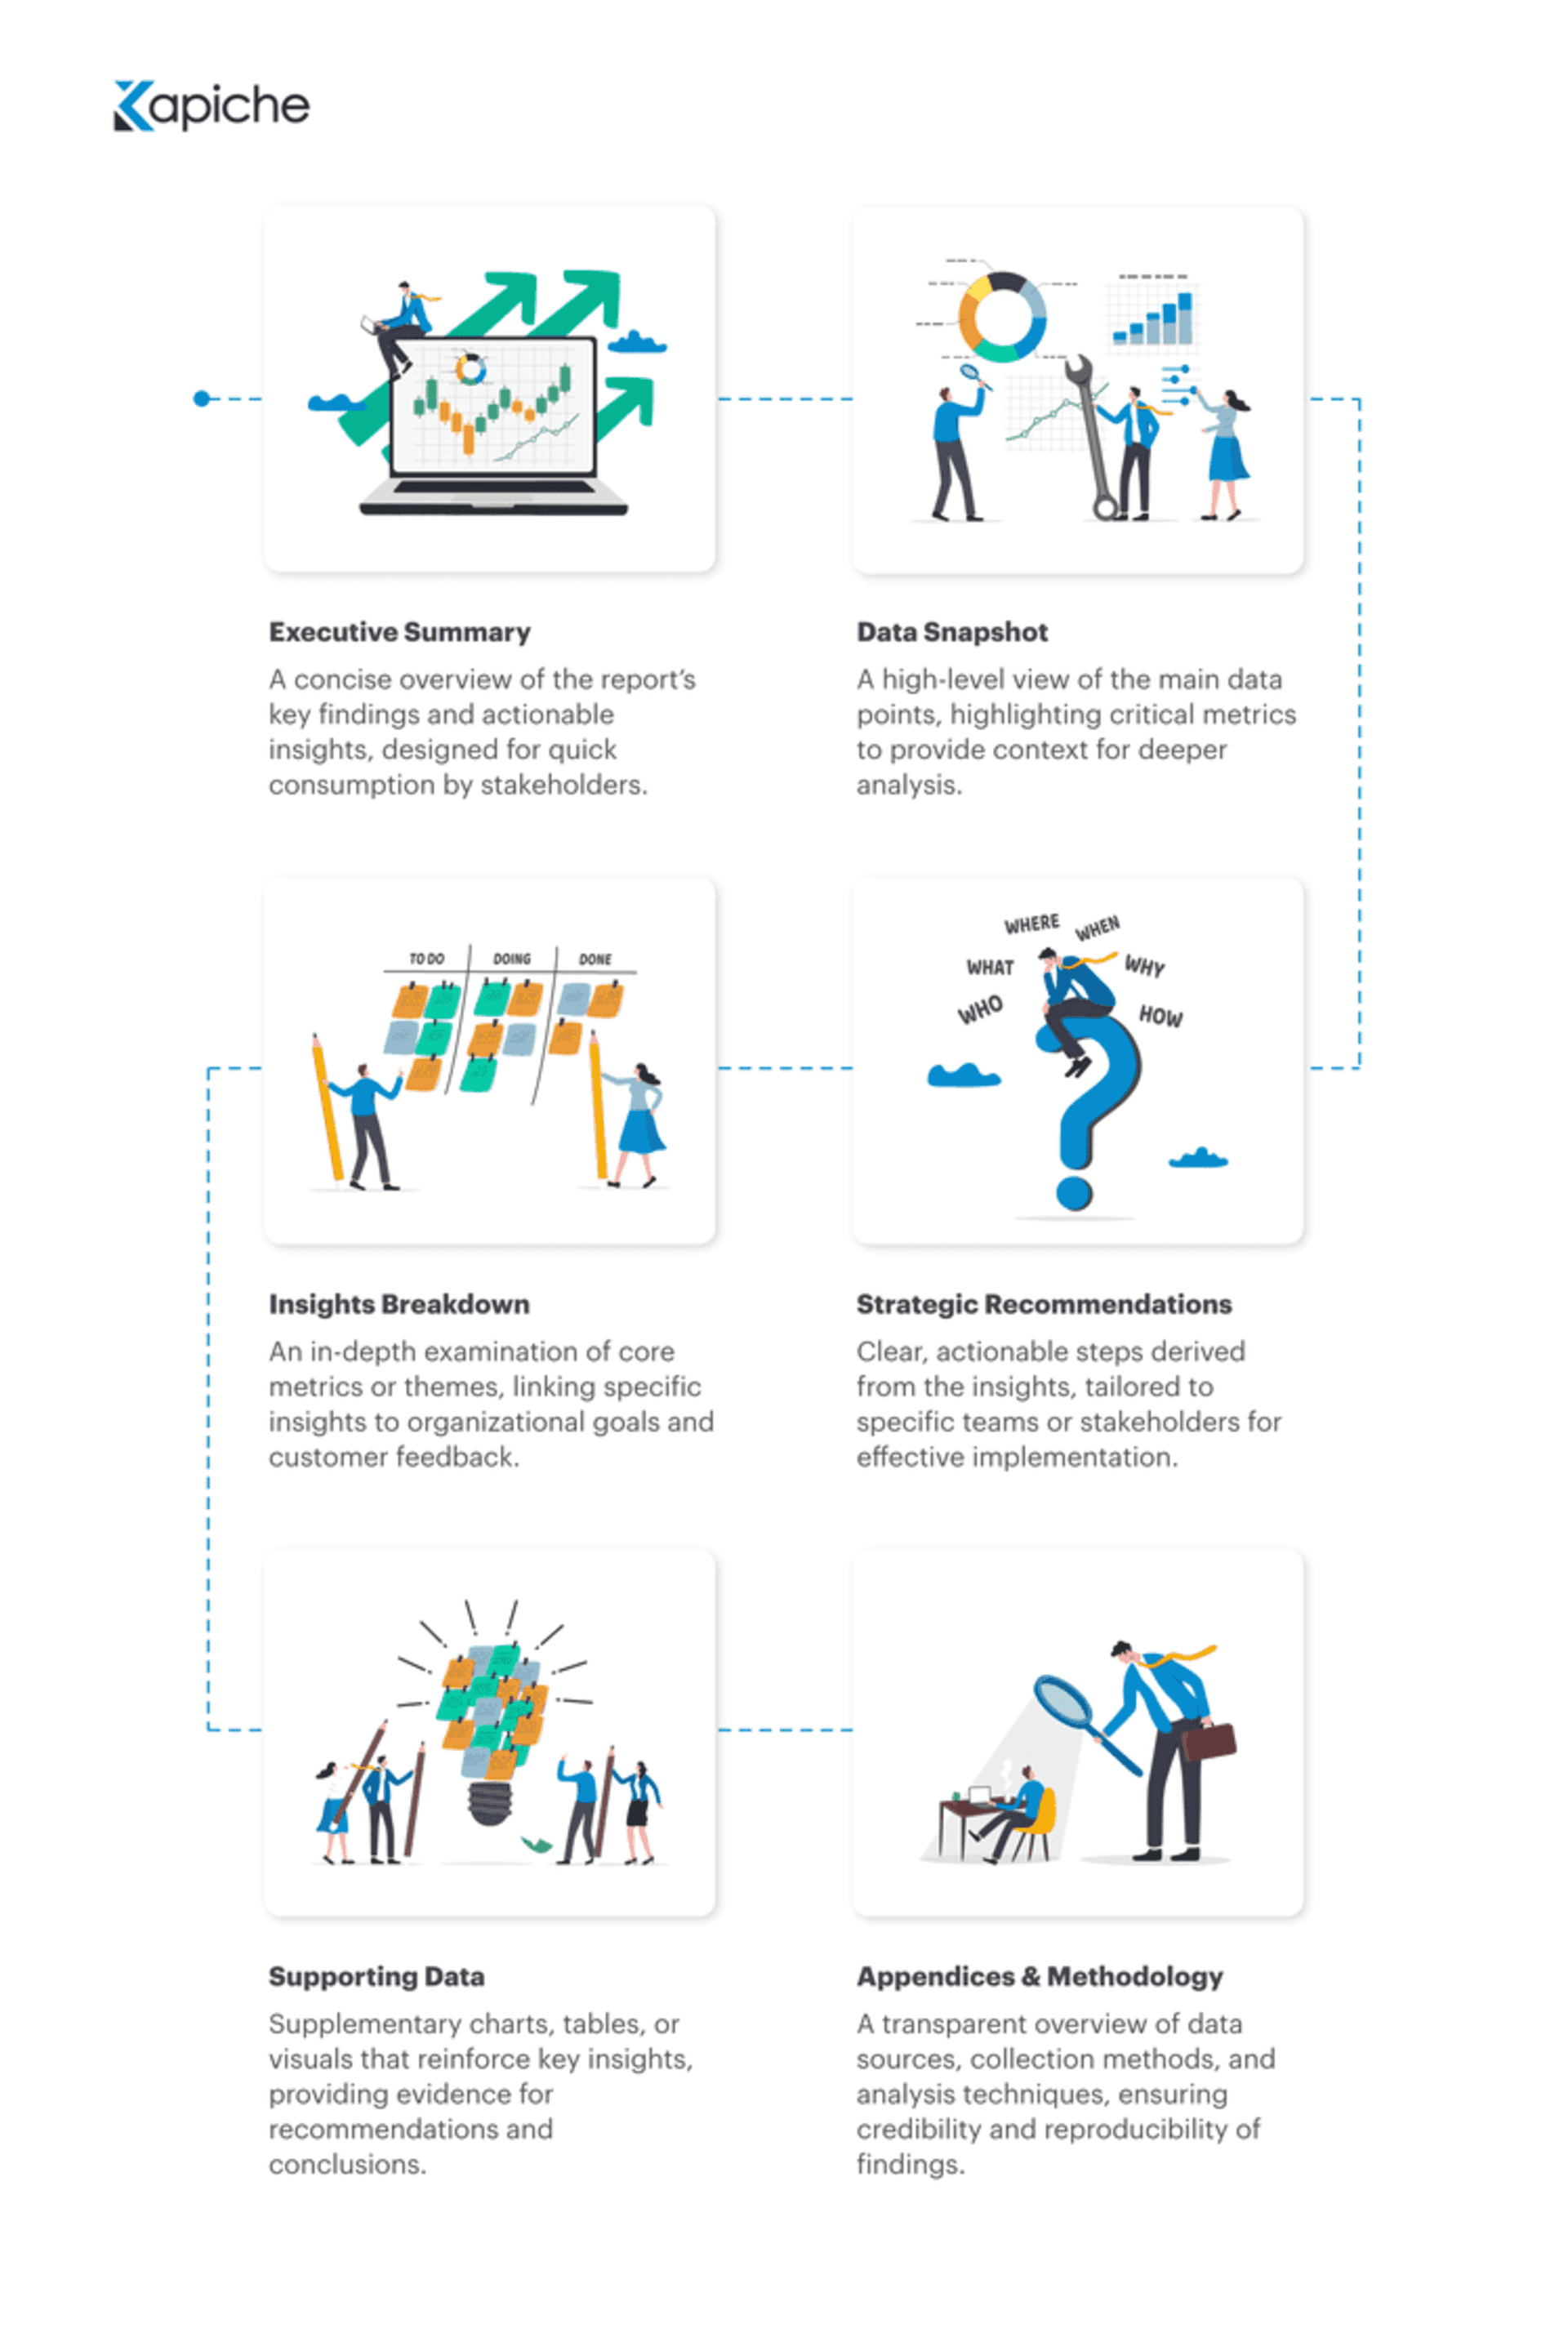
Key Elements for a Well-Structured Report:
Start with the Big Picture: Open with a brief executive summary that highlights top findings and why they matter. This overview helps readers understand the core insights at a glance and decide what to prioritize.
Break Insights into Themes: Group insights into meaningful themes, such as "Customer Service Challenges" or "Product Satisfaction Drivers," to make it easier for readers to navigate. Each theme should have a concise headline and summary.
Include Recommendations and Next Steps: After presenting key insights, provide actionable recommendations that align with company objectives, like investing in specific customer service improvements or focusing on a product feature upgrade.
Close with a Data Summary: Conclude with a summary of supporting data or key metrics to validate your insights. This data should include any relevant graphs or metrics that back up the report’s findings.
Step 3: Designing for Visual Impact
Great reporting isn’t just about what you say—it’s about how you present it. Clear, visually engaging design elements make complex insights easier to digest, ensuring key takeaways don’t get lost in a wall of text. Using visuals strategically can make your report memorable and drive home critical points.
Best Practices for Visual Design:
Use Color-Coded Themes: Apply consistent colors to each theme or insight category to help readers quickly associate insights with specific areas (e.g., green for growth areas, red for pain points).
Include Simple, Impactful Charts: Rather than using complicated graphs, opt for simple bar charts, line graphs, or pie charts that quickly convey trends and comparisons.
Highlight Key Data Points with Icons: Use icons or symbols to call out critical statistics, like a thumbs-up symbol for positive feedback or a caution sign for negative trends.
Make Use of White Space: To avoid overwhelming the reader, space out content, leaving enough white space around visuals and text sections to keep the report clean and approachable.

Step 4: Setting Up Automated Reporting with Kapiche
For busy insights teams, automation can streamline the reporting process, ensuring that insights are regularly updated and accessible across the organization.
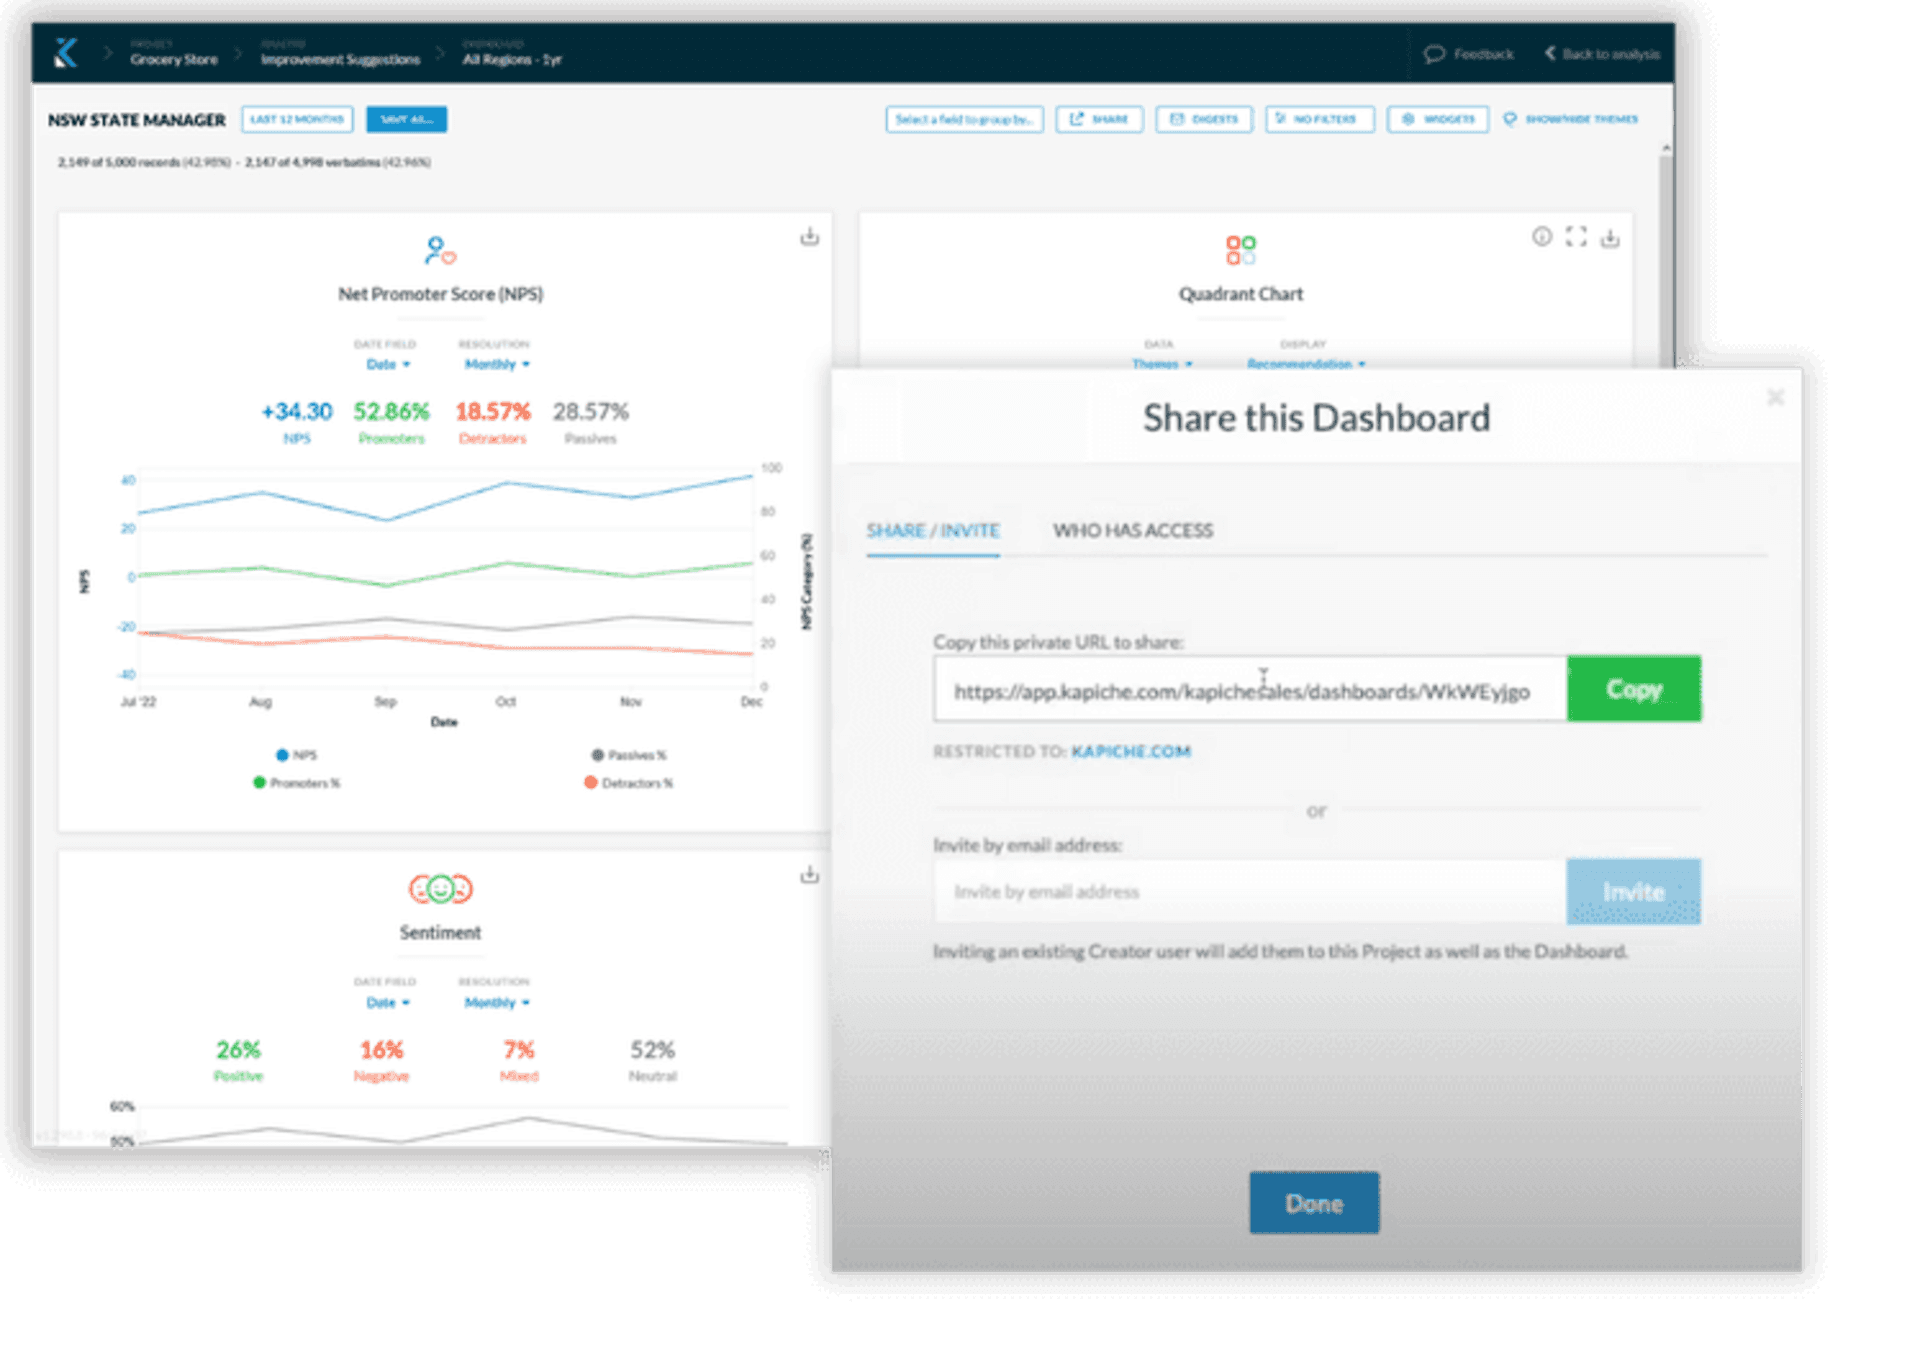
Kapiche’s automated reporting tools enable users to set up custom dashboards, saving time and making it easier to share real-time updates.
How to Make the Most of Automated Reporting:
Identify High-Impact Metrics for Automation: Focus on automating metrics that directly support key company goals, like Net Promoter Score (NPS) changes, recurring customer issues, or product usage trends.
Customize Dashboards for Key Stakeholders: Create dashboards tailored to specific audiences so each team member sees the most relevant data at a glance.
Set Up Scheduled Reports: Use Kapiche’s scheduling tools to automatically send out updated reports to stakeholders at regular intervals, such as monthly or quarterly.
Use Alerts for Immediate Attention: Kapiche allows you to set up alerts for sudden changes in key metrics, like a spike in negative feedback, ensuring your team can respond quickly.
Step 5: Turning Insights into Action
The ultimate goal of reporting is to drive action. By making sure insights are clear, relevant, and accessible, you can influence decisions and get buy-in from teams across the organization.
Building a decision-making framework into your report helps readers transition from passive understanding to active implementation.
Framework for Action-Oriented Reporting:
Align Insights with Business Objectives: Connect each insight directly to business goals, like "improving retention rates" or "reducing service time," so stakeholders understand the potential impact.
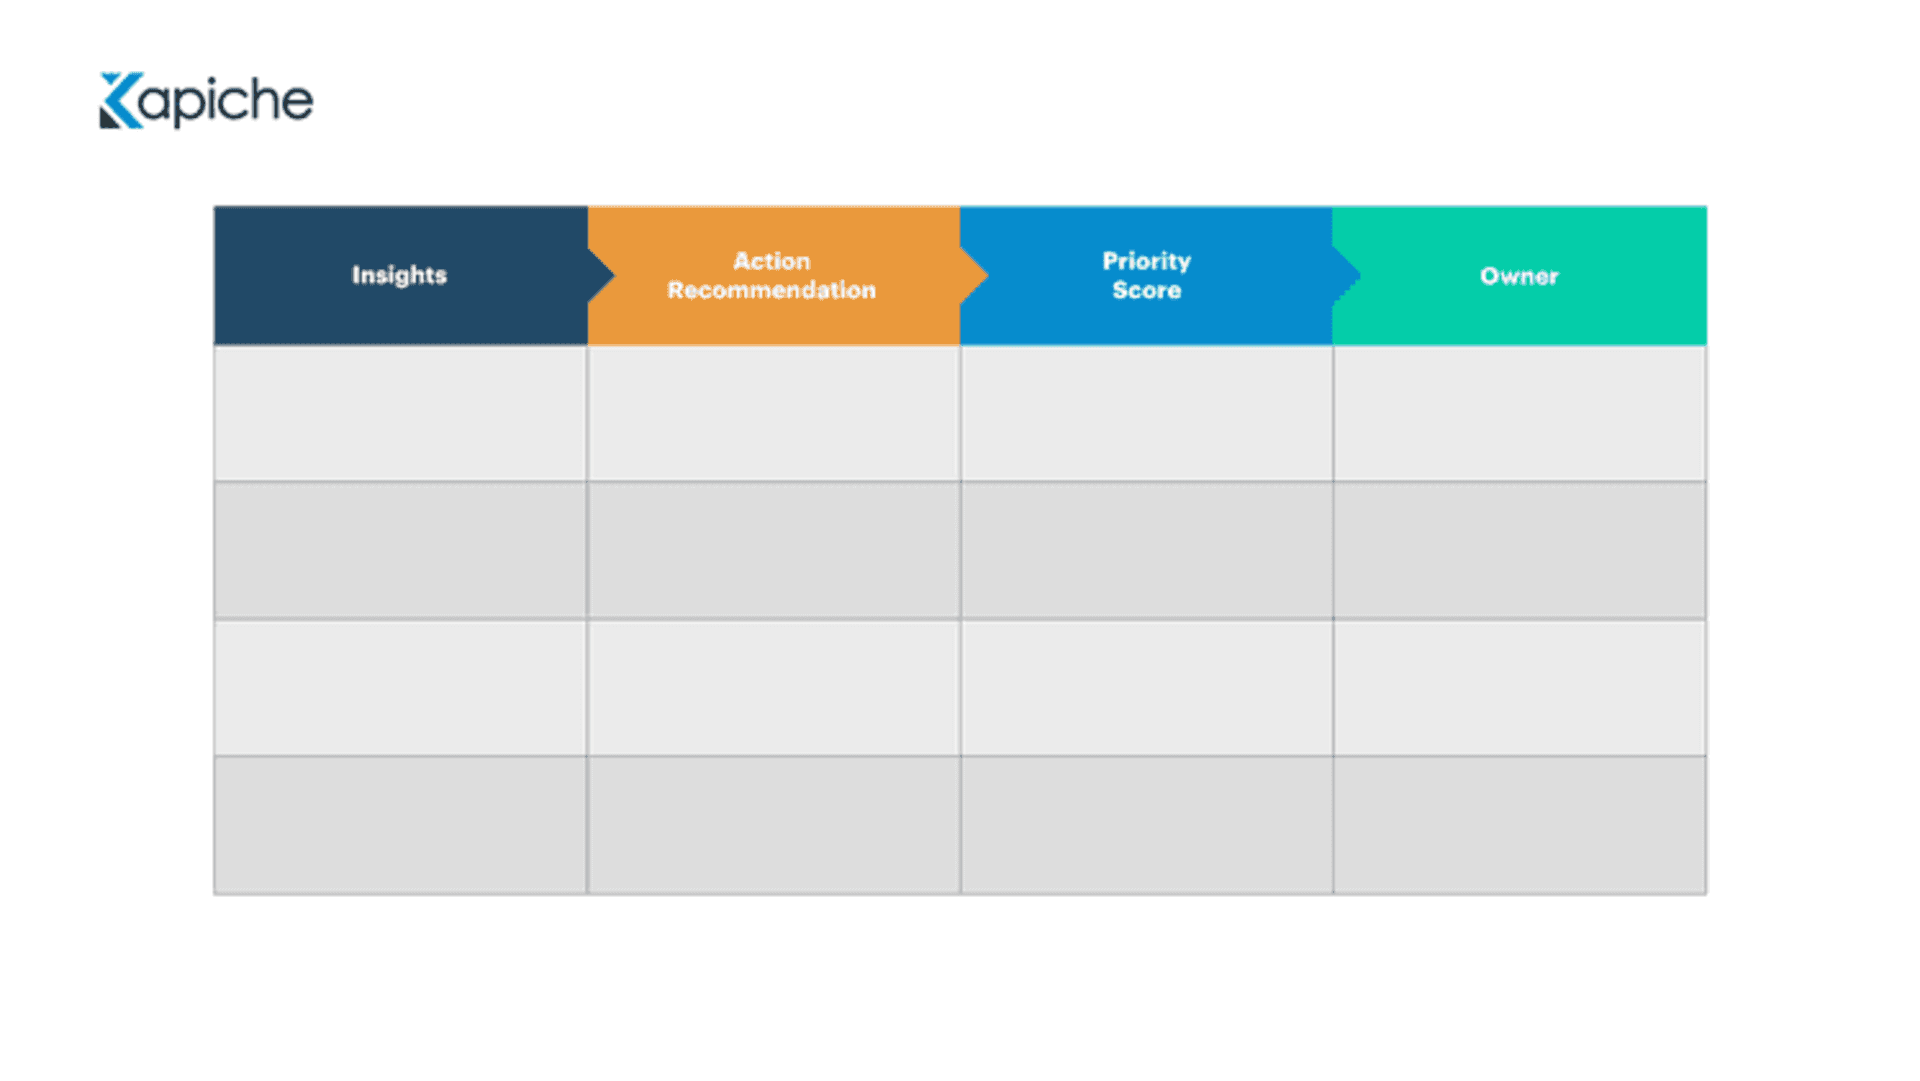
Define Clear Actions for Each Insight: For every insight presented, include a suggested action step or recommendation to make it easy for decision-makers to follow through.
Use a Simple Decision-Making Framework: Consider including a checklist or framework to help stakeholders determine priorities (e.g., a quick scoring matrix based on potential impact, ease of implementation, and cost).
Assign Ownership for Accountability: Make sure each recommended action has an assigned owner and a clear timeline, such as “Product Team - Q1 2025.”
Let’s Get You Started on Actionable Reporting
To help you put this playbook into action, we’ve created a Decision-Making Checklist and Reporting Framework for you. The resource includes:
A Step-by-Step Checklist for assembling your insights into compelling, clear reports.
A Decision-Making Framework to help you prioritize insights based on impact, ease of implementation, and alignment with your goals.
Practical Tips and Examples for structuring reports and dashboards that drive action across your organization.